Were Top Corporate Executives Really Hogging Workers’ Wages?
Thomas Piketty attributes rising inequality in the U.S. primarily to huge increases in the salaries of CEOs and other top executives, but he misinterprets the evidence. Rising salaries of top executives actually explain very little of the rise in inequality, and they depressed other employees’ pay by only a negligible amount.
By Andrew KlimanThomas Piketty attributes rising inequality in the U.S. primarily to huge increases in the salaries of CEOs and other top executives, but he misinterprets the evidence. Rising salaries of top executives actually explain very little of the rise in inequality, and they depressed other employees’ pay by only a negligible amount.
In his best-selling book “Capital in the Twenty-First Century,” French economist Thomas Piketty identifies “the rise of the supermanager” — that is, “top executives of large firms who have managed to obtain extremely high, historically unprecedented compensation packages for their labor” — as “the primary reason for increased income inequality in recent decades.” [1]
Leading economists and economics writers have been quick to endorse this view. In The New York Times, columnist Paul Krugman contended that “soaring inequality has to date … largely been driven by labor income — by ‘supermanagers.’ ” Staff writer John Cassidy of The New Yorker agreed that “ ‘supermanagers’… account for up to seventy per cent of the top 0.1 per cent of the income distribution.” And Nobel laureate Robert M. Solow, professor emeritus of economics at MIT, claimed that “much of the increased income (and wealth) inequality in the United States is driven by the rise of … supermanagers,” that is, “top executives of large corporations, with very rich compensation packages.”
Piketty bases his “supermanager” explanation of rising inequality on a recent study of the occupations of people in the top 0.1 percent and top 1 percent income groups, but that study actually indicates that rising salaries of top executives have been only a minor cause of growing income inequality in the U.S. It also suggests that the degree to which increases in the salaries of top executives depressed other employees’ compensation is just as minor. [2]
Although Piketty does not deal directly with the latter issue, if the huge rise in supermanagers’ salaries were the chief cause of rising inequality, it would also be the chief cause of the relatively slow increase in the pay of the typical worker over the past few decades. Top executives would have captured a much larger share of the total amount of money paid out in compensation, leaving other employees in the dust. This, in effect, is what critics of an April article of mine in Truthdig contend.
In that article I showed that official U.S. government statistics for the 1970–2007 period indicate that, as shares of the Net Domestic Product (value produced by the nation’s industries, after depreciation) of the corporate sector and the wider business sector, compensation paid to employees did not trend downward, and businesses’ profits did not trend upward. Thus, the average worker’s hourly compensation fully kept pace with his or her productivity, and the claim of a productivity/compensation gap is misleading. (It results, as I showed, from inconsistent inflation-adjustment.)
Yet as critics of the article note correctly, the official employee-compensation numbers themselves might be misleading. Those numbers include “compensation” received by top salaried executives, most of which is arguably a share of the profits of the corporations that employ them, rather than payment for the labor services they provide. If Piketty’s supermanagers were hogging bigger and bigger chunks of total employee compensation, one could argue that the demonstrated failure of “profits” to rise at the expense of “compensation” is a statistical mirage since, if we reclassified the lavish salaries paid to supermanagers as profit rather than employee compensation, we would find that the corporate profit share of Net Domestic Product rose substantially, at the expense of the “real” workers’ share.
The critics’ line of reasoning depends crucially on the assertion that supermanagers were hogging substantially larger and larger shares of employee compensation. Despite what Piketty writes, this assertion turns out to be unfounded.
How Many of the Super-Rich Are Supermanagers?
Compensation of top salaried executives has indeed increased rapidly. This increase has had little effect on inequality and on other employees’ pay, however, because there were too few supermanagers for their rising salaries to have made a significant difference. This seems to be the key fact that Piketty gets wrong.
In a crucial statement, Piketty writes: “Recent research … allows me to state that the vast majority (60 to 70 percent, depending on what definitions one chooses) of the top 0.1 percent of the income hierarchy in 2000-2010 consists of top managers.” [3] He bases his claim on a recent study by Jon Bakija, Adam Cole and Bradley Heim (BC&H). This study, the first comprehensive examination of the occupations of “the 1%,” is extraordinarily important, but Piketty has seriously misinterpreted it.
Contrary to what he says, BC&H found that between 2001 and 2005 (the final year they studied), only 21 percent of those in the top 0.1 percent of tax filers were “salaried nonfinancial managers” (“executives,” “managers” and “supervisors”). (These managers were also just 21 percent of “the 1%.” [4]) This is a far cry from “the vast majority.”
How then does Piketty come up with his 60 percent figure? Although the figure appears in BC&H’s study, it does not refer to salaried managers alone. It bundles together three distinct occupational groups: (1) salaried managers, (2) owner-managers of closely held noncorporate businesses and (3) “financial professionals.” The owner-managers and the large majority of financial professionals are not supermanagers in Piketty’s sense. Together, however, they comprise nearly two-thirds of his “vast majority.” [5]Let’s consider the owner-managers first. They are not supermanagers because they do not receive, in Piketty’s words, “very high salaries” or “historically unprecedented compensation packages for their labor.” [6] Instead they receive very high “business income” — profit-like income that accrues to owners of noncorporate businesses (partnerships and sole proprietorships) and S-corporations. While, according to BC&H, 94 percent of the combined labor and business income of salaried managers was labor income — wages and salaries, including stock-option income — a full 88 percent of the combined labor and business income of owner-managers was business income. [7]
Business income is not a component of employee compensation. It is a distinct kind of income and it is counted that way in government statistics. This fact is crucially important in understanding why the rising salaries of top executives had little effect on typical employees’ pay. When the business income of owner-managers rises (and BC&H’s data suggest that it rose to a whopping extent), regular workers’ share of employee compensation is not reduced; it remains unchanged. It is certainly true that when top-echelon owner-managers take in a bigger share of the income generated by noncorporate businesses, their rising share must come at the expense of something else. But it came at the expense of the interest they paid creditors and the incomes of other business owners and self-employed people, not at the expense of employees. In fact, employees’ share also rose. [8]
What about BC&H’s “financial professionals”? Some of them fit Piketty’s description of “supermanagers” since they are salaried managers as well (top managers of financial firms or financial managers in nonfinancial firms). Yet the remaining financial professionals have little in common with supermanagers. Some are owner-managers, such as hedge fund managers and managers of venture capital and other private equity firms, whose representation at the top of the income distribution seems to have risen extraordinarily rapidly. (In 2005, the top 25 hedge fund managers made as much as the top 500 corporate CEOs. [9]) Others aren’t managers at all. They work in sales occupations (as traders and brokers of stocks, bonds and commodities, for instance), as investors, in other business occupations (as accountants, financial advisers, etc.), and in computing, engineering and other technical occupations.
To gauge the extent to which growing inequality and subpar growth of typical employees’ pay can be attributed to “the rise of the supermanager,” we must therefore focus solely on salaried managers and set aside owner-managers and nonmanagerial financial professionals. Data in the published version of BC&H’s study are not well suited to this task because the published version treats all financial professionals, whatever their occupation, as a single group. But one of the authors, Bakija, kindly provided me with unpublished data from their study, in which financial professionals who are also top salaried managers are included in the latter group. By eliminating the overlap among salaried managers, owner-managers and other financial professionals, the unpublished data enable us to say precisely what percentage of “the 0.1%” and “the 1%” consisted of salaried managers, and to estimate the degree to which their rising salaries depressed other employees’ compensation. [10]
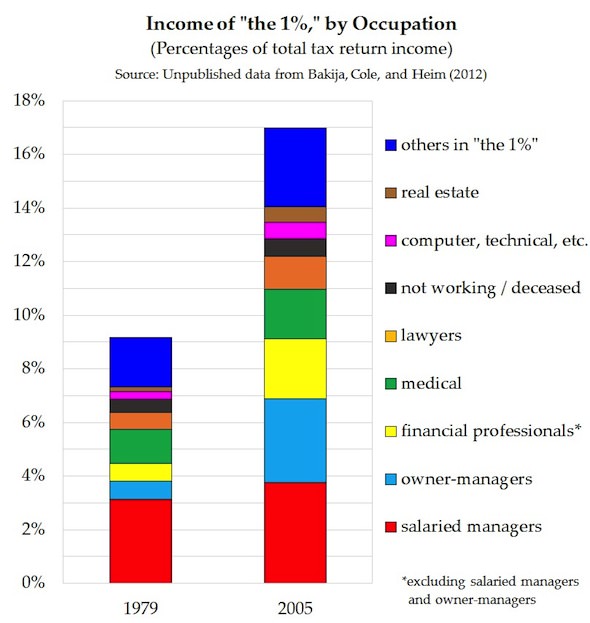
The unpublished data reveal that, between 2001 and 2005, only about one-sixth of financial professionals in the top-income groups were salaried managers as well. Thus, when we reclassify them as salaried managers, supermanagers’ representation within the top-income groups does not increase substantially. BC&H’s unpublished data indicate that only 24 percent of the top 0.1 percent, and 23 percent of the top 1 percent, were financial or nonfinancial salaried managers — scarcely more than the 21 percent, mentioned in the previous section, who were nonfinancial salaried managers. Furthermore, they were a shrinking segment of the super-rich. In 1979, 39 percent of those in the top 0.1 percent were supermanagers, but by 2005 their size had declined dramatically to 22 percent. Owner-managers increasingly took their place, rising from 10 percent to 23 percent, while the share of those who were nonmanagerial financial professionals rose from 9 percent to 14 percent. [11] The “rise of the supermanager” to which Piketty refers therefore seems not to have occurred.
The Rise in Supermanagers’ Compensation
By how much did the compensation of these top salaried managers rise? BC&H’s unpublished data provide an important part of the answer. The following graph, based on that data, looks at the occupations of people in “the 1%” and the shares of total tax-return income that went to them. Between 1979 and 2005, the increase in salaried managers’ income accounted for only 8 percent of the total rise in the share of income captured by “the 1%.” [12] This is roughly the same as the contributions of lawyers and of doctors and other medical professionals. Much more of the total rise in the income share of “the 1%” was due to rising incomes of owner-managers and financial professionals.
 BC&H’s unpublished data tell us how much the total income of top salaried managers increased. To assess how much their employee compensation increased, we also need to know how much of their total income (apart from capital gains) consisted of compensation and how much consisted of interest payments, dividends and other kinds of income. BC&H do not report this, however, so the figures must be estimated.
If we assume, unrealistically, that all of the income of salaried managers in the top 0.1 percent was employee compensation — that is, that they received no interest, dividends, etc. — then the BC&H data imply that their share of business-sector Net Domestic Product rose by a mere 0.4 percentage points as of 2005 — in effect, not at all. The corresponding figure for salaried managers in the top 1 percent group is 0.5 percentage points. [13]
However, top salaried managers must have received some income in addition to compensation. It thus seems more realistic to assume that the relative sizes of their dividend, interest and wage-and-salary income were equal to those of others in their income group, and that the remaining share of their income (business income, rental income, and nonwage compensation) was small enough to be safely ignored. These alternative assumptions lead to results that differ only slightly from those above. The share of the product captured by salaried managers in the top 0.1 percent once again rises by 0.4 percentage points as of 2005. The corresponding figure for salaried managers in the top 1 percent is now 0.6, rather than 0.5, percentage points.
Since these estimates depend partly on assumptions about the employee-compensation share of supermanagers’ income, they are a bit rough. Yet a wide range of other reasonable assumptions — including those that imply that supermanagers’ compensation rose much more rapidly than their total income — lead to quite similar results. [14] It therefore seems extremely unlikely that the rising compensation of top salaried managers boosted their share of business-sector Net Domestic Product by even 1 percentage point.
Effect of Rising Supermanager Pay on Other Employees
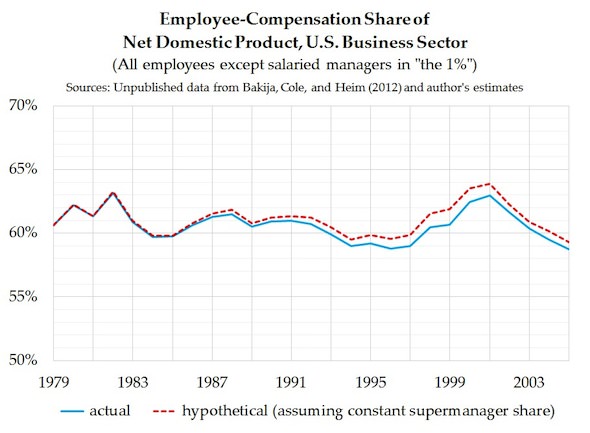
Since the share of Net Domestic Product that represents top salaried managers’ compensation increased negligibly, the resulting decline in other employees’ share was also negligible. The graph below presents my estimate of the share of the product obtained by other employees between 1979 and 2005 as well as the share they would have obtained if that of the top salaried managers’ had not risen at their expense. [15] The difference between what they actually received and what they would have received is quite minor. (Moreover, their actual share does not trend downward to a significant degree. This implies that the slight rise in the supermanagers’ share did not seriously depress other employees’ share.)
The graph makes clear that, criticisms of my previous article notwithstanding, the failure of corporate profits to rise at the expense of employee compensation was no “statistical mirage.” Whether we use the government’s definitions of “profit” and “compensation” (as I did in that article), or reclassify supermanagers’ pay as profit and count only other employees’ compensation as “true” compensation (as I have done in the graph), employees’ share of Net Domestic Product remained basically unchanged over time.
In dollar terms, my estimates imply that if compensation captured by salaried managers in the top 0.1 percent had not risen at their expense, other employees’ compensation in 2005 would have been about $36 billion greater. If compensation captured by salaried managers in the whole top 1 percent had not risen at their expense, other employees’ compensation would have been about $50 billion greater. Spread among more than 100 million employees, this is not a great deal of money. Additional compensation of $36 billion amounts to $342 per employee, or about 20 cents per hour more. Additional compensation of $50 billion amounts to $480 per employee, or about 28 cents per hour more. [16]Although average (mean) compensation fully kept pace with productivity between 1970 and the Great Recession, the typical (median) worker’s compensation increased somewhat more slowly. Yet since rising compensation of supermanagers did not greatly reduce other employees’ pay, it is responsible for very little of the growth in the gap between median and average compensation. To estimate the total size of this median/average compensation gap, we can look at data accompanying a 2012 paper by Lawrence Mishel of the Economic Policy Institute and Kar-Fai Gee, now employed at the Canadian Department of Finance. Their estimates imply that the typical worker’s hourly compensation, $17.70 in 2005, would have been $21.16 if his or her compensation had kept pace with the hourly compensation of the average employee from 1979 onward. [17] This is a difference of $3.46 per hour. The reduction in pay of 20 or 28 cents per hour due to rising compensation of top managers is only 6 or 8 percent of the total $3.46 difference.
Thus, more than 90 percent of the post-1979 gap in median workers’ compensation relative to average employee compensation remains unaccounted for. Even if we assumed that the share of business-sector Net Domestic Product received as employee compensation by salaried managers in the top 1 percent rose by a full percentage point (which, again, seems extremely unlikely), this would account for only 14 percent of the post-1979 growth in the gap between the typical (median) worker’s compensation and the average employee’s compensation.
The supposed “rise of the supermanager” therefore seems not to explain much of the growth in income inequality seen in the U.S. It is certainly not the primary cause of the rising share of income captured by “the 1%” and the “0.1%.” Nor is it a main driver of the divergence between median compensation on one hand and average compensation and productivity on the other. It follows that this latter trend must be due, overwhelmingly, to increasing inequality among the rest of the workforce — that is, within the gigantic pool of employees who are not supermanagers. Thus, if we want to understand why the typical worker’s pay has increased relatively modestly, we must set aside the myths that rising profits and skyrocketing executive salaries were the chief culprits and focus on the sources of increasing inequality among workers, as I will in a future piece.
(Reference notes available on next page.)
Andrew Kliman is a professor emeritus of economics at Pace University in New York and author of “The Failure of Capitalist Production: Underlying Causes of the Great Recession” (Pluto Books, 2012) and “Reclaiming Marx’s ‘Capital’: A Refutation of the Myth of Inconsistency” (Lexington Books, 2007). See his website here.
Notes
1. Thomas Piketty, Capital in the Twenty-First Century, p. 302, p. 315.
2. I will use the rather stilted terms “employee” and “compensation,” rather than ”worker” and “wages,” partly to avoid entering into controversy over whether all employees are “real” workers, and partly to emphasize that I am referring to wages and benefits rather than wages alone.
3. Thomas Piketty, Capital in the Twenty-First Century, p. 302.
4. These percentages refer to income including capital gains. The percentages for income excluding capital gains were very similar.
5. Piketty’s 70 percent figure seems to be just a mistake. He may be referring to another statistic in BC&H, pertaining to these three groups’ combined contribution to the rise in the share of income captured by “the 0.1%.”
6. Thomas Piketty, Capital in the Twenty-First Century, p. 302.
7. Moreover, this 88 percent figure underestimates the owner-managers’ business income, since some of the remaining 12 percent consists of labor income that their spouses and dependents received. Consider, for example, an owner-manager who brings home $730,000 in business income and has a wife who works as an accountant, doctor, or lawyer and receives a salary of $100,000. Although 12 percent of this combined income is labor income, the owner-manager is quite unlike Piketty’s supermanagers, since he paid himself no salary at all.
8. As a share of the noncorporate business sector’s national income, employee compensation rose from 33.9% in 1979 to 37.2% in 2005, while business income (“proprietors’ income”) fell from 45.6% to 44.3% and net interest payments fell from 11.2% to 8.1%. The data are published in National Income and Product Account (NIPA) Table 1.13, lines 10, 11, 14, and 16.
9. See Steven N. Kaplan and Joshua Rauh, “Wall Street and Main Street: What Contributes to the Rise in the Highest Incomes?,” 2009, p. 28.
10. My references to BC&H’s data above drew on the published version; from this point forward, I refer exclusively to their unpublished data.
11. Much of the gain in the owner-managers’ share at the expense of the salaried managers’ share is a consequence of a 1986 law that reduced the top tax rate on individual income below the top rate for corporate income. This change eliminated owner-managers’ incentive to incorporate their businesses and report their income as employee compensation instead of as business income.
12. The corresponding figure for the top 0.1% income group is 12 percent.
13. Business-sector Net Domestic Product is reported in NIPA Table 1.9.5 (line 2). The incomes of salaried managers in the top 0.1 and top 1% are their shares of income (as reported in BC&H’s unpublished data) times total tax-return income, reported in Table A0, col. 4 of the updated spreadsheet file accompanying Thomas Piketty and Emmanuel Saez’s paper, “Income Inequality in the United States, 1913-1998.” My second (more realistic) set of estimates uses data in Table A7 of Piketty and Saez’s file to compute the wage-and-salary shares of wage/salary, dividend, and interest income of the top 0.1% and top 1% income groups. My estimate of salaried supermanagers’ employee compensation is the product of this wage-and-salary share and their total income.
14. For the whole top 1% group, wages and salaries, as a share of wages and salaries plus dividends plus interest, were 74.2% in 1979 and 82.3% in 2005. If we assume that the corresponding shares for salaried managers in the top 1% were 66.6% in 1979 and 89.9% in 2005, the rise in their share of business-sector Net Domestic Product would still fall short of one percentage point. These latter percentages imply that, as shares of business-sector Net Domestic Product, compensation of salaried supermanagers in “the 1%” rose more than twice as rapidly (101%) as their total income (49%).
15. The graph is based on my second (more realistic) estimate of top salaried managers’ compensation discussed above. My estimate of other employees’ compensation is total compensation of business-sector employees, reported in NIPA Table 1.13 (sum of lines 4 and 11) minus the estimated compensation of salaried managers in “the 1%.” I divided the difference by business-sector Net Domestic Product, reported in NIPA Table 1.9.5 (line 2) to obtain the other employees’ share of the product. (BC&H report income shares only for 1979, 1993, 1997, 1999, and 2001–5; linear interpolation was used to estimate income shares of salaried managers in intervening years.)
16. These numbers are based on my estimates of the number of employees in the business-sector (103.9 million) and the average number of hours they worked in 2005 (1711.2). The estimates are based on NIPA data on employment and hours in private industries and government enterprises, and on an estimate of nonprofit-sector employment reported in Table 2 of a Congressional Research Service study. Business-sector employment is private-industry employment plus employment in government enterprises minus employment in the nonprofit sector.
17. To obtain nominal figures, I multiplied the real median and average hourly compensation figures reported in Mishel and Gee’s Appendix Table A1 (cols. 2 and 3, respectively) by the implicit price index reported in col. 9 of their Appendix Table A3.
Your support matters…Independent journalism is under threat and overshadowed by heavily funded mainstream media.
You can help level the playing field. Become a member.
Your tax-deductible contribution keeps us digging beneath the headlines to give you thought-provoking, investigative reporting and analysis that unearths what's really happening- without compromise.
Give today to support our courageous, independent journalists.
 Environment
At least, not fast enough to reach international targets.
Environment
At least, not fast enough to reach international targets.
 Politics
But MAGA world's feud with Swift is an excellent vehicle for observing the ever-quickening decay of American politics.
Politics
But MAGA world's feud with Swift is an excellent vehicle for observing the ever-quickening decay of American politics.
 TD Original
The multibillion-dollar Effective Altruism movement makes rich people feel good about being rich — to hell with the bad publicity.
TD Original
The multibillion-dollar Effective Altruism movement makes rich people feel good about being rich — to hell with the bad publicity.
 TD Original
A well-wishing appreciation of Matt Christman.
TD Original
A well-wishing appreciation of Matt Christman.
 Book Review
A new book by former Greek finance minister Yanis Varoufakis argues that capitalism as we knew it has been displaced by a twenty-first century feudalism.
Book Review
A new book by former Greek finance minister Yanis Varoufakis argues that capitalism as we knew it has been displaced by a twenty-first century feudalism.
 TD Original
Social disappearing acts reflect the deepening inhumanity of a technology-addled, coldly transactional world.
TD Original
Social disappearing acts reflect the deepening inhumanity of a technology-addled, coldly transactional world.
You need to be a supporter to comment.
There are currently no responses to this article.
Be the first to respond.