A Geography of Dissent In Time
A Penn State doctoral candidate made a time-lapse visualization of what appears to be every recorded protest on the planet since 1979 that shows a flood of resistance sweeping the planet beginning with the anti-globalization movement of the late 1990s.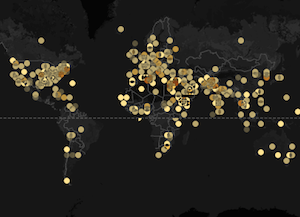
A Penn State doctoral candidate made a time-lapse visualization of what purports to be every recorded protest on the planet since 1979 that shows a flood of resistance sweeping the planet beginning with the anti-globalization movement of the late 1990s.
Foreign Policy says:
This is what data from a world in turmoil looks like. The Global Database of Events, Language, and Tone (GDELT) tracks news reports and codes them for 58 fields, from where an incident took place to what sort of event it was (these maps look at protests, violence, and changes in military and police posture) to ethnic and religious affiliations, among other categories. The dataset has recorded nearly 250 million events since 1979, according to its website, and is updated daily.
See Ph.D. student John Beiler’s illustration here.
— Posted by Alexander Reed Kelly.
Your support matters…Independent journalism is under threat and overshadowed by heavily funded mainstream media.
You can help level the playing field. Become a member.
Your tax-deductible contribution keeps us digging beneath the headlines to give you thought-provoking, investigative reporting and analysis that unearths what's really happening- without compromise.
Give today to support our courageous, independent journalists.
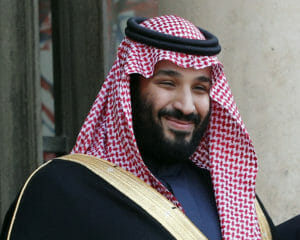 An immediate inquiry is sought amid findings Mohammed bin Salman appears to have had access to Washington Post owner's private messages.
 The U.S. war on the free press, free speech, and dissent more generally, are all rooted in the so-called "Good War."
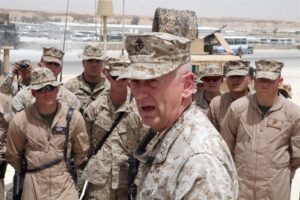 The mostly retired military leaders are clamoring to prolong an unsanctioned war with a muddled and dubious mission in Syria.
 The Truthdig columnist and U.S. Army officer tells Truthdig Editor in Chief Robert Scheer that U.S. foreign policy since 9/11 makes us less safe.
 When did the FBI, or any U.S. intelligence agency, become Veritas, the virtue of truthfulness and model of integrity?
 Speaking truth to power is the right thing to do, but it can be a lonely journey.
You need to be a supporter to comment.
There are currently no responses to this article.
Be the first to respond.