20,000 Scientists Underscore Alarm Over Changing Climate
They have added their signatures to a document titled “Letter Warning Humanity.”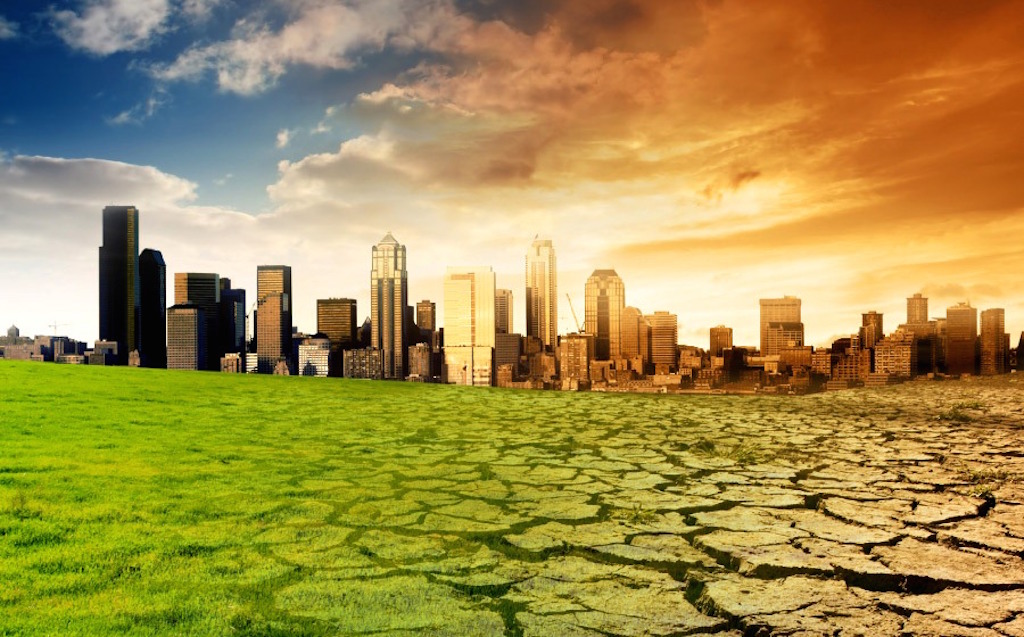 Shutterstock
The “Letter Warning Humanity” from scientists has now been signed by over 20,000 scientists, as The Independent notes.
The reason for this alarm is given in these charts:
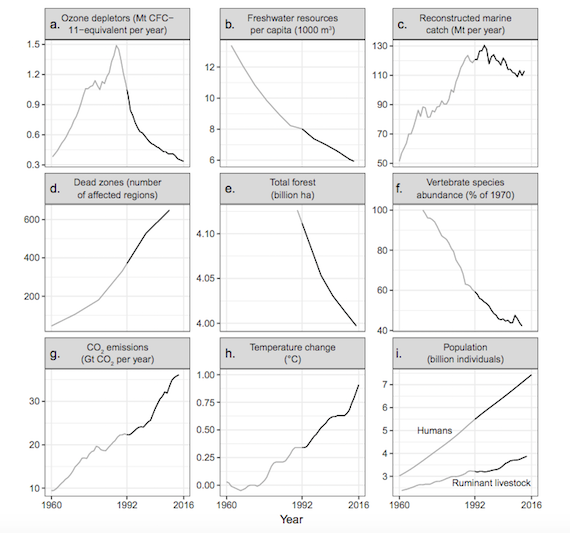
They show alarmingly accelerating carbon dioxide emissions (we were up worldwide again last year), declining access to fresh water, and endangered species and other dangers facing the globe.
Only a redesign of our energy grid and the way we do industrialized society, including giving up most use of plastics and many pesticides and burning fossil fuels, can avert the catastrophes they describe.
So far, no sign they are being taken seriously.
The scientists explain the graphs this way:
Your support matters…“Descriptions of variables and trends in Figure
Ozone depletion, Figure 1a. During the 1970s, human-produced chemicals known as ozone-depleting substances, mainly chlorofluorocarbons, were rapidly depleting the ozone layer. In 1987, governments of the world came together and crafted the United Nations Montreal Protocol as a global attempt to address this issue. With protocol compliance, emissions of halogen source gases (ozone-depleting substances and natural sources) peaked in the late 1980s and since then they have significantly decreased (Figure 1a). Global ozone depletion is no longer increasing, and significant recovery of the ozone layer is expected to occur by the middle of this century (Hegglin et al. 2014).
Declining Freshwater availability, Figure 1b.Per capita freshwater availability is less than half of levels of the early 1960s (Figure 1b, AQUASTAT 2017) with many people around the world suffering from a lack of fresh clean water. This decreasein available water is nearly all due to the accelerated pace of human population growth.It is likely that climate change will have an overwhelming impact on the freshwater availability through alteration of the hydrologic cycle and water availability. Future water shortages will be detrimental to humans, affecting everything from drinking water, human health, sanitation, and the production of crops for food.Unsustainable marine fisheries,
Figure 1c. In 1992, the total marine catch was at or above the maximum sustainable yield and fisheries were on the verge of collapse. Reconstructed time series data show that global marine fisheries catches peaked at 130 million tonnes in 1996 and has been declining ever since (Figure 1c). The declines happened despite increased industrial fishing efforts and despite developed countries expanding to fishing the waters of developing countries (Pauly andZeller 2016, updated).
Ocean dead zones, Figure 1d. Coastal dead zones which are mainly caused by fertilizer runoff and fossil-fuel use, are killing large swaths of marine life. Dead zones with hypoxic, oxygen-depleted waters, are a significant stressor on marine systems and identified locations have dramatically increased since the 1960s, with more than 600 systems affectedby 2010 (Figure 1d, Diaz and Rosenberg 2008, updated). Forest loss,
Figure 1e. The world’s forests are crucial for conserving carbon, biodiversity, and freshwater. Between 1990 and 2015, total forest area decreased from 4,128 to 3,999 million ha, a net loss of 129 million ha which is approximately the size of South Africa (Figure 1e). Forest loss has been greatest in developing tropical countries where forests are now commonly converted to agriculture uses (FAO 2015).Dwindling biodiversity,
Figure 1f.The world’s biodiversity is vanishing at an alarming rate and populations of vertebrate species are rapidly collapsing (World Wildlife Fund 2016). Collectively, global fish, amphibians, reptiles, birds, and mammals declined by 58% between 1970 and 2012 (Figure 1f).Here, we display a diversity-weighted Living Planet Index that has been adjusted for taxonomic and geographic bias by accounting for the estimated number of species within biogeographical regions, and the relative species diversity within them. (McRae et al. 2017).Freshwater, marine, and terrestrial populations declined by 81%, 36%, and 35% respectively (McRae et al. 2017).Climate change,
Figure 1g, Figure 1h. Global fossil-fuel carbon dioxide emissions have increased sharply since 1960 (Figure 1g, Boden et al. 2017). Relative to the 1951-1980 average, global average annual surface temperature, in parallel to CO2 emissions, has also rapidly risen as shown by 5-year mean temperature anomaly (Figure 1h, NASA’s Goddard Institute for Space Studies (GISS) 2017). The 10 warmest years in the 136-year record have occurred since 1998. The most recent year of data, 2016, ranks as the warmest on record.Temperature increases will likely cause a decline in the world’s major food crops, an increase in the intensity of major storms, and a substantial sea level rise inundating major population centers.
Population growth, Figure 1i. Since 1992, the human population has increased by approximately 2 billion individuals, a 35% change (Figure 1i, FAOSTAT 2017). The world human population is unlikely to stop growing this century and there is a high likelihood that the world population will grow from 7.2 billon people now to between 9.6 and 12.3 billon by 2100 (Gerland et al. 2014). Like the change in human population, the domestic ruminant population, which has its own set of major environmental and climate impacts, has been increasing in recent decades to approximately 4 billion individuals on Earth (Figure 1i, FAOSTAT 2017).”
Independent journalism is under threat and overshadowed by heavily funded mainstream media.
You can help level the playing field. Become a member.
Your tax-deductible contribution keeps us digging beneath the headlines to give you thought-provoking, investigative reporting and analysis that unearths what's really happening- without compromise.
Give today to support our courageous, independent journalists.



You need to be a supporter to comment.
There are currently no responses to this article.
Be the first to respond.