
The Rich Get Richer
According to the most recent data from the IRS, the wealthiest 1 percent of Americans took home a greater share of the nation's income in 2006 than in any year of the previous 19. It's possibly the biggest income disparity Americans have seen since the Great Depression. The average tax rate of the super-rich was at its lowest level in at least 18 years.
According to the most recent data from the IRS, the wealthiest 1 percent of Americans took home a greater share of the nation’s income in 2006 than in any year of the previous 19. It’s possibly the biggest income disparity Americans have seen since the Great Depression. The average tax rate of the super-rich was at its lowest level in at least 18 years.
Your support matters…Wall Street Journal:
According to the figures, the richest 1% reported 22% of the nation’s total adjusted gross income in 2006. That is up from 21.2% a year earlier, and is the highest in the 19 years that the IRS has kept strictly comparable figures. The 1988 level was 15.2%. Earlier IRS data show the last year the share of income belonging to the top 1% was at such a high level as it was in 2006 was in 1929, but changes in measuring income make a precise comparison difficult.
The average tax rate in 2006 for the top 1%, based on adjusted gross income, was 22.8%, down slightly from 2005 and the fifth straight year of declines. The average tax rate of this group was 28.9% in 1996, and was 24% in 1988.
As the wealthiest Americans’ share of income has risen, so has their share of the income-tax burden. The group paid 39.9% of all income taxes in 2006, compared with 27.6% in 1988. In the most recently reported five years, however, the share of income reported by the very wealthy has risen faster than the group’s share of income taxes.
Independent journalism is under threat and overshadowed by heavily funded mainstream media.
You can help level the playing field. Become a member.
Your tax-deductible contribution keeps us digging beneath the headlines to give you thought-provoking, investigative reporting and analysis that unearths what's really happening- without compromise.
Give today to support our courageous, independent journalists.
 It's not just about food, says author Rebecca Lester, but shame and self-negation.
 She was in her 20s when the book chronicling her addiction and depression was published, igniting a debate that lasted for much of her life.
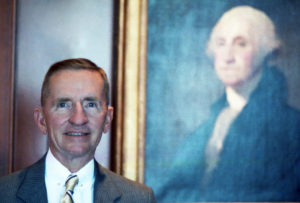 The Texas billionaire is perhaps best remembered for earning the largest vote share of any third-party hopeful since Theodore Roosevelt.
 A new book examines how corporate capitalism, through fossil fuel-based technology, has led the world to the point of destruction.
 Researchers have remained skeptical, but data indicate that teens face an epidemic of anguish that is nothing short of staggering.


You need to be a supporter to comment.
There are currently no responses to this article.
Be the first to respond.